

For several years, ITrust has been exploring the potential of AI for cybersecurity. By leveraging machine learning and intelligent correlation, tools such as Reveelium make it possible, for example, tosignificantly enhance log analysis. As part of this R&D initiative, Thomas Anglade, our Lead Data Scientist, presents his work here.
This article presents data analysis and machine learning methods for performing behavioral modeling on firewall data in order to detect suspicious behavior associated with that data.
In recent years, the number and variety of cyberattacks have increased significantly. Today, there is a wide range of cyberthreats (Denial of Service, Distributed Denial of Service, phishing, Command & Control, botnets, malware, ransomware, etc.). Given the large volume of data generated by corporate network equipment (proxies, firewalls, servers, etc.), it seems essential to supplement human expertise with artificial intelligence algorithms in order to develop effective detection systems tailored to the threats faced.
This article outlines the steps for implementing a UEBA-type behavioral analysis method (1) to detect advanced attacks in firewall data.
Data Used
The modeling is based on logs from a firewall that recorded traffic between machines within a network over a two-week period, totaling 14 GB. The data contains all messages exchanged between IP addresses on the network, along with all associated information (source IP, destination IP, port used, and volume of data exchanged).

Illustration: For each data row, we have the message time, the source IP address, the destination IP address, the communication port, the firewall action, and the number of bytes sent and received
There are approximately 2 million log lines per day, which justifies the use of artificial intelligence methods to process such a large volume of data.
Modeling Method
The data can be represented mathematically as a graph (IP-IP communication graph). Each IP address represents a node in the graph. As soon as a message is exchanged between two IP addresses, a connection is established between the two nodes in the graph.
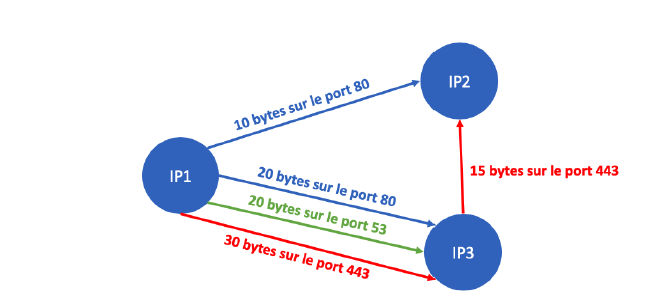
Illustration: A schematic representation of firewall logs in the form of a graph containing 3 IP addresses and 5 messages. Messages on port 443 are shown in red, messages on port 53 in green, and messages on port 80 in blue.
Based on this model, it is possible to answer the following questions:
– Which IP addresses are the most significant and most active in the logs?
– What are the different phases of activity shown in the communication timeline?
– What types of messages are sent? Do these message types vary depending on the time of day? (day / night / weekend, etc.)
By combining all this information, we can algorithmically create a “composite sketch” of the network’s activity and identify periods during which the observed behavior deviates significantly from the norm. These abnormal periods trigger an anomaly alert, which is forwarded to the investigation teams at the “Security Operations Center,” who then confirm or rule out the threat. The algorithm’s performance can be evaluated based on several criteria, but two will be prioritized:
– the percentage of detected attacks (true positives)
– the percentage of false alarms (false positives).
An optimal system should detect as many attacks as possible while maintaining a relatively low false-positive rate.
Network Behavior Analysis:
By observing how the graph changes over time, it is possible to gain a precise understanding of the computer network's behavior. For example, analyzing the number of nodes in the graph over time yields the following results:
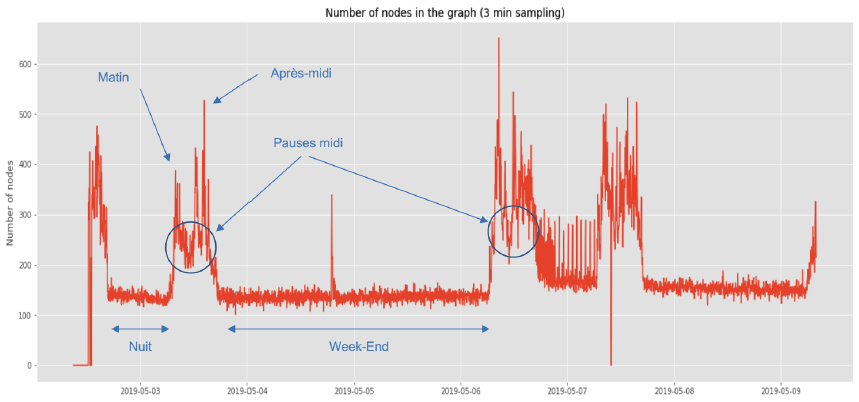
Illustration:Number of nodes in the Firewall data graph between May 2 and May 9.
In this diagram, the network's activity patterns are clearly visible:
– very low volume on the weekend
– steady activity between 9 a.m. and 6 p.m.
– a drop corresponding to the lunch break.
It is possible to identify anomalies, such as the spike in activity observed around 11 p.m. during the weekend of May 4 and 5.
Results obtained:
Using artificial intelligence algorithms, it is possible to set up a system that automates these tasks and detects various types of cyberattacks targeting the firewall, particularly “Command & Control” attacks, which involve taking control of a set of IP addresses to exfiltrate a large volume of information from the network by splitting files into pieces that are then exfiltrated individually by each IP address. This algorithm was detailed in the scientific paper presented by the iTrust teams during “European Cyber Week 2019” in Rennes on November 20, 2019: https://www.cesar-conference.org/wp-content/uploads/2019/09/resume_soum10.pdf
1 Behavioral Analysis of Network Entities and Users (see: https://digitalguardian.com/blog/what-user-and-entity-behavior-analytics-definition-ueba-benefits-how-it-works-and-more)
T.A., Lead Data Scientist
Copyright ITRUST©